


Step-by-step guide to getting started with data analysis in Python
I decided to create this straightforward Python tutorial about connecting your Stripe API with Python to help you understand your online revenue data using your payment information.
If you are running an eCommerce or SaaS business like myself, you must be a number-oriented entrepreneur. Otherwise, you will find it difficult in today’s market, where all companies invest a considerable amount of money and countless hours on data analysis projects.
Before I begin, I want to highlight the following:
- I will show you step by step how to connect your Stripe account and retrieve your payments (charges in Stripe) using Python. For this tutorial, I will use an API-KEY-TEST with dummy data.
- This blog is not a full Python tutorial. Therefore, it would be better you have some knowledge about the syntax and the libraries used. Nevertheless, I will be as straightforward as possible with my code lines.
Python libraries:
These are the libraries that I will use throughout the tutorial. Here below, you can find the links so you can install them in your environment:
- Stripe: https://pypi.org/project/stripe/
- Pandas: https://pypi.org/project/pandas/
- Numpy: https://pypi.org/project/numpy/
- Seaborn: https://pypi.org/project/seaborn/
- Matplotlib: https://pypi.org/project/matplotlib/

Stripe API Keys:
You are here to learn how to retrieve your Stripe’s revenue data most efficiently. Therefore using Excel is not an option. Let me show you how to connect to your Stripe API with Python. First of all, you need to go to your Stripe account and then follow these steps:
- Developer
- API Keys
- Copy the Secret key (Make sure it is the Live Secret key mode to retrieve your actual revenue data)

Stripe Auth:
Create a global variable called stripe.api_key, which contains your Stripe account secret key. This variable will allow you to retrieve, update, create or delete your Stripe data.
Therefore, you have to be careful with this token, meaning that this information cannot be shared with anyone unrelated to your business growth.
Charge.list is the API that returned all the payments processed (Successful, failed, ctr). Here is the link to the Stripe API Documentation so you can review and understand the JSON objet, which contains all the values related to a payment.
Since Stripe limits your API request for only 100 records, I created a function that allows you to retrieve your historical payments.
You need to consider that this function will require a lot of computing power if you are retrieving years of Stripe payments data.
I highly recommend to create an app and process this information in the cloud. I am using my laptop’s computing power for this tutorial because I am dealing with less than 3K Stripe payments.

A JSON object will be returned when you run the query named charge. This is a difficult data format to work with, therefore you need to convert it from JSON to readable data frame using the Python’s library called Pandas.

Convert from JSON to Pandas data frame:
The built-in Pandas function DataFrame.from_records allows you to convert from JSON format to Pandas data frame. You can also create your custom data source by selecting only the values required for your analysis.
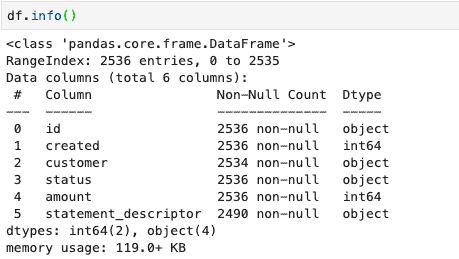
In this case, I will only use the charge id (unique identifier), created (the date when that charged was processed), customer id (unique identifier), status, amount, and statement_descriptor.

Run the query df.info() to see your data type. In this case, you need to pay close attention to your data structure. For example, Stripe stored the date (created) in Unix-Time and the amount in cents. Therefore, you have to convert both variables to be able to perform your analysis.
Below, you can see that I created a new column called “amount_converted,” dividing the amount by 100.
Remember that Stripe returns this variable in cents, meaning that 500 is equal to $5. I also converted the column “created” from Unix-Time to DateTime using a built-in Pandas function called pd.to_datetime.

Separate months and years from your timestamp:
To create relevant insights about your revenue, you need to highlight ups and downs in a timeline.
Therefore, it is necessary to know how to clean and format your timestamps correctly because these values are stored as Strings or Unix-Time in most databases.
Here, I share some excellent built-in functions and tricks in Pandas to separate the months and years from the timestamps.
I created a global variable named DateTime, which will add two new columns; month and year.
Since the variable created was already converted from Unix-Time to DateTime, you can use the built-in Pandas function to get the months, years, weeks, and even hours for separate.

Pivot tables with Pandas:
Once you have connected, retrieved, and cleaned your revenue data from your Stripe API, you can start doing your analysis to produce high-level insights that will drive better performance for your business.
Here you can find some examples of pivot tables and chart to help you take action over your most important KPIs.
Pivot Tables:
Status:

Services:

Datetime:

Bar Chart:

Get Started for free:
- Integrate your Stripe account for free here.
- Get access to more than 100 KPIs in real-time.
- Analyze and track your subscriptions.
- Forecast your revenue and other KPIs.
- Reduce your churn.
Read about how Radix can help you grow your online business (SaaS, eCommerce, etc)


