Every SaaS company has a goal to increase customer retention. It’s one of the hidden metrics of a company’s growth, and it’s also incredibly hard to optimize for. This is because every customer doesn’t leave for the same reason — everyone leaves for different reasons. However, there are still certain ways to identify why your customers are leaving, and that’s where these 10 Customer Retention Metrics come in.
Success in SaaS isn’t just about acquiring more customers. It’s also about keeping on to (or retaining) the ones you have.
Customer retention entails engaging customers and persuading them to continue purchasing products or services from your company. Its importance to the success of your SaaS business should not be underestimated.
10 Key Customer Retention Metrics
In this post, we break down the metrics that will help you determine if your company has a retention problem and how to improve it.
We understand how important customer retention is for SaaS success. But then there’s the question of how to measure it.
The strategy of measuring customer retention varies depending on your company’s industry and subscription model.
For example, if you sell a software subscription with yearly payment (i.e., customers primarily engage with your service on an annual basis), it makes sense to track customer retention over the year.
If your customers use your service regularly – such as the usual monthly subscription model used in B2C – it’s best to track customer retention over a shorter period so you can notice crucial patterns and opportunities.
After you’ve selected which option is ideal for your company, it’s time to look at the key customer retention metrics to start tracking and analyzing
1) Customer Retention Rate
Customer retention in the SaaS industry refers to the total of all business operations executed to retain long-term customers and make them more profitable.
Customers that use SaaS must make recurrent purchases by renewing their subscriptions regularly. To measure retention, you must first establish a time range, such as one day, one week, or two weeks. The time limit must be determined by your product team based on where returning customers tend to churn.
Customer retention rate is calculated by multiplying the number of paying customers after a given period by the number of paying customers at the beginning of that period by 100.
High retention leads to higher loyalty and word-of-mouth marketing, provides potential for account development, and boosts your customer lifetime value.
2) Renewal Rate
The renewal rate is the percentage of your customers that sign up for a new subscription after their existing one expires. It’s crucial because the longer a customer remains with you, the more profitable they are.
A high renewal rate might suggest that your company is doing well. However, if your business is more temporary and short-term in nature, the renewal rate may not necessarily be the greatest sign of success.
The closer you go to a renewal rate of 100 %, the healthier your business is.
To calculate your renewal rate, divide the number of customers who did renew by the number of customers that could renew.
You should also consider your average subscription period, whether it is yearly, quarterly, or monthly, and base your renewal rate on that.
3) Customer Churn Rate
The customer churn rate is the percentage of customers that abandoned your product or service over a certain period.
You can calculate the churn rate by dividing the number of churned customers throughout the period by the number of customers at the beginning of the period and multiplying the ratio by 100.
You may calculate the churn rate weekly, monthly, or yearly. Nonetheless, most companies compute it on a monthly or annual basis. They both provide the same information since multiplying the monthly churn rate by 12 gives the yearly rate.
There is no such thing as a uniformly excellent churn rate. The churn rate, however, will never be zero.
It’s typical for churn to rise in tandem with the number of customers in your company as it grows. What you must do is ensuring that your revenue grows enough to counteract churn and maintain an acceptable rate.
Actively tracking churn helps to evaluate the health of your company and how happy customers are with your primary offering. If your churn rate remains high, you will need to take action to minimize churn since it is clear that your product has some major issues.
4) Revenue Churn Rate
The revenue churn rate is the speed at which your company loses money from current customers over a set period. This might happen if your customers downgrade their service package or cancel an order.
A high revenue churn rate might suggest that your current customers are unsatisfied with your product or service, which is why it’s such an important metric to understand and analyze.
In the SaaS market, a company’s age and price point will influence what is considered ‘normal’ revenue churn.
Companies less than three years old often have revenue churn ranging from 4% to 24%, whereas companies over ten years old experience revenue churn ranging from 2% to 4%.
In terms of price point, companies with low monthly recurring revenue have revenue churn rates ranging from 5 to 16 %, while those with high MRR have rates ranging from 2 to 8 %
We propose measuring your revenue churn rate every month, but make sure your calculations exclude any money from new customers during this time. This is one of the most important customer retention metrics.
Revenue Churn Rate = [(MRR at Start of Month – MRR at End of Month) – MRR in Upgrades during Month] / MRR at Start of Month
5) Customer Lifetime Value (CLV)
The customer lifetime value (CLV) is the predicted stream of revenue generated by each paying customer throughout the relationship.
As a result, CLV equals the ratio of overall marketing and sales costs to new customer acquisition. Along with knowledge from previous and current customers, CLV allows you to forecast the profitability of a new customer.
For example: Company A discovers that their average CLV over three years is $8000. This implies that each customer pays around $2,000 per year. If the sale CRM anticipates 14 new sales each month with an average of 2 churned customers, each new month will generate an additional $24,000 to invest.
As a result, CLV enables you to make informed investment decisions in areas like recruiting, real estate, and marketing.
6) Expansion MRR
In Addition, We have Expansion MRR.
Expansion monthly recurring revenue is the amount of money generated by add-ons and upgrades in a single period. Upsells, cross-sells, and add-ons are three methods for increasing your expansion MRR.
The expansion MRR rate quantifies the rate at which your expansion MRR grows. Divide the increment in expansion MRR in a particular month by the expansion MRR at the beginning of that month, and multiply the result by 100.
While gaining new users has a 5 % 20% success rate, selling to an existing customer has a remarkable 60 % -70 % success rate.
Enhancing your expansion MRR helps you in reaching negative churn, which happens when revenue produced from cross-sells, upsells, and add-ons exceed revenue lost due to churn each month.
7) Average Revenue Per User (ARPU)
The average monthly revenue collected per paying client is the average revenue per user (ARPU). SaaS companies generally have many subscription plans, making ARPU even more crucial.
Divide your monthly recurring revenue (MRR) by the number of paying customers to determine ARPU.
Therefore, the average revenue per user reveals how important your customers are to your company.
Many businesses reduce their customer acquisition expenses without considering the amount of revenue their customers may create. Which is preferable? Is it better to spend $10 to get a customer who spends $30 on average or $60 to acquire a user whose ARPU is $300?
Furthermore, ARPU reflects how effective your pricing is. If your ARPU is higher than your medium-price plan, you should consider updating your subscription plans because most of your customers value higher pricing plans.
8) Net Revenue Retention (NRR)
Net revenue retention is a number that reflects the security of your SaaS company. It shows you how much recurring revenue you’ve kept from current customers over a specific time. NRR includes upgrades, downgrades, and churn to provide a clear picture of how much your company may expand based only on its existing customer base.
NRR = (Starting MRR – Contraction MRR) – (Churn MRR + Expansion MRR) / Starting MRR x 100%
9) Customer Acquisition Cost (CAC)
The primary cost of acquiring new customers is the amount spent on sales and marketing efforts. This is known as the client acquisition cost (CAC).
To calculate CAC, sum all of your marketing and sales costs over a specific period (annual or monthly) and divide the total by the number of customers acquired during that time.
CAC may be calculated for all of your marketing and sales operations or just one channel. When marketing managers calculate CAC for each channel, it helps them figure out where they should adjust their marketing budget.
You must also include in the remaining costs, which include:
- Paid Ads
- Sales CRM Software
- Graphic Design
- Marketing Videos
A good CAC payback period for SaaS businesses is 5-12 months, however, this might vary depending on the stage of the company. In general, you should aspire for a CAC payback period of little more than 12 months.
10) Net Promoter Score (NPS)
Finally, The Net Promoter Score (NPS) is a customer loyalty and satisfaction metric that asks customers if they are likely to suggest your product to others (on a scale of 1-10).
You calculate The NPS score by subtracting the percentage of detractors from the percentage of promoters.
Detractors who rate you 6 or below are more likely to churn, but promoters who rate you 9 or 10 are your most devoted customers and supporters. Passives are those that are indifferent to your product but can be converted into promoters.
We propose that you include a qualitative follow-up question in your NPS survey to get the reason for their rating.
Based on the reasons, you may follow up with promoters to make the best use of their loyalty and address opponents’ issues to convert them to promoters.
Net Promoter Score = % of Promoters – % of Detractors
Conclusion
In conclusion: Taken together, these 10 customer retention metrics should provide a solid framework for tracking, analyzing, and understanding product growth in SaaS companies. Prioritizing these elements can help companies build sustainable growth and prevent an influx of vanity metrics from leading them astray. The best products are the ones that meet user needs and exceed expectations, which is the real goal of growth.
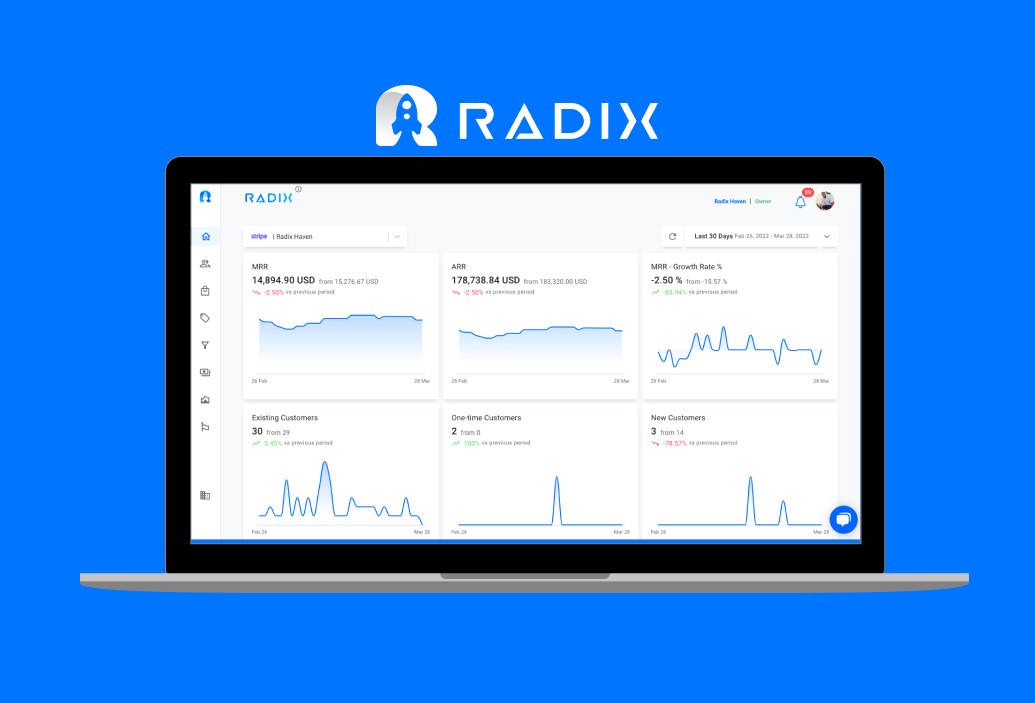
You can track & analyze these customer retention metrics in real-time with Radix. Create your free account and connect your PayPal and Stripe accounts for free

Read More:
15 Ways to Reduce Churn: Radix Edition
Revenue Churn: Definition, How to Calculate, Ways to Track & Improve
SaaS Metrics: What Are The Top 5 VCs Look At For Series A/B/C?


