We are all about MRR, and I have decided to calculate Netflix MRR using public data sources. Therefore, this analysis cannot be taken as a reference.
Monthly Recurring Revenue, commonly referred to as MRR, is the main objective for any subscription business. No matter how big or small the organization is, this KPI is rigorously analyzed every month, stressing out entrepreneurs worldwide.
Do you want to know how to calculate Monthly Recurring Revenue? Read here.
I want to highlight the following:
- To calculate the MRR accurately, you must also have data on churn, upgrades, downgrades, and activations. Of course, Netflix doesn’t disclose this information.
- This is MRR is just an estimation based on the following KPIs that are publicly available:
- Total Subscribers
- Average Subscription Price
- We will be using Python for this analysis, but this is not a tutorial.
- Data sources links:
Let’s the data analysis begin
1) Python Libraries:
- Pandas: data analysis and manipulation tool.
- Numpy: support for large, multi-dimensional arrays and matrices, along with a large collection of mathematical functions.
- Plotly: The coolest graphic library for Python.
2) Python Code:
- Run Jupyter Lab on your terminal.
- Import the following Python libraries.
- premium_subscriber.xlsx is an Excel file that I created using Statista as a data source:
- Total of subscribers (paid)
- Premium Subscribers
- From Q1 2015 to Q3 2021
- Total of subscribers (paid)

3) Calculate the Delta for the total MRR by quarter:
- The MRR can be calculated without calculating Delta. I did it just to show you my Python skills.
- To calculate the variance, I used two Python functions; diff() and shift().

4) Let’s stop to analyze some KPIs:
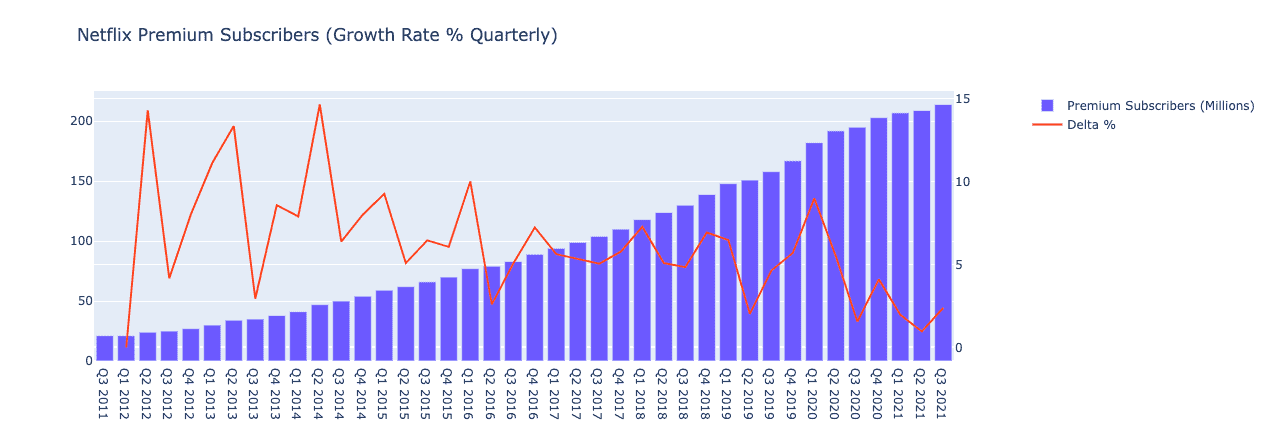
- The number of premium subscribers on Netflix has been growing by 6.18% on average each quarter.
- 193M subscribers has been added since Q3 2011.


5) Average Revenue Per User (ARPU):
- We need a starting point to calculate revenue based on the millions of subscribers quarterly, so I calculated the ARPU using the following criteria:
- I used the Netflix Pricing Page to get the different plans:
- $9.99
- $15.49
- $19.99
- The following is an estimation of average revenue per user based on adding up the plan’s prices and dividing them by the total plans (which are three):
- The ARPU is $15.15
- I used the Netflix Pricing Page to get the different plans:
- Having calculated the ARPU, we can now have an estimation of the total revenue by quarter, year, etc.

6) Let’s stop to analyze the MRR:
- Netflix has surpassed 2 billions in MRR (Quarterly!!!) 75% of the time.
- The standard deviation exceeds $900M quarter by quarter (we can definitely say that Netflix is doing an outstanding job by increasing its revenues at this rate).

7) Monthly Recurring Revenue (Quarter by Quarter):

8) Annual Recurring Revenue:
- Based on the MRR analysis, Netflix’s ARR was above $11b in 2020. (Covid-19 definitely impacted this KPI positively).
- Netflix’s ARR has been growing by 58% year over year.
Clearly, Netflix is on course to become one of the biggest companies, especially in its industry. I will definitely buy some stocks.
This growth is remarkable!!!! Go Netflix team.

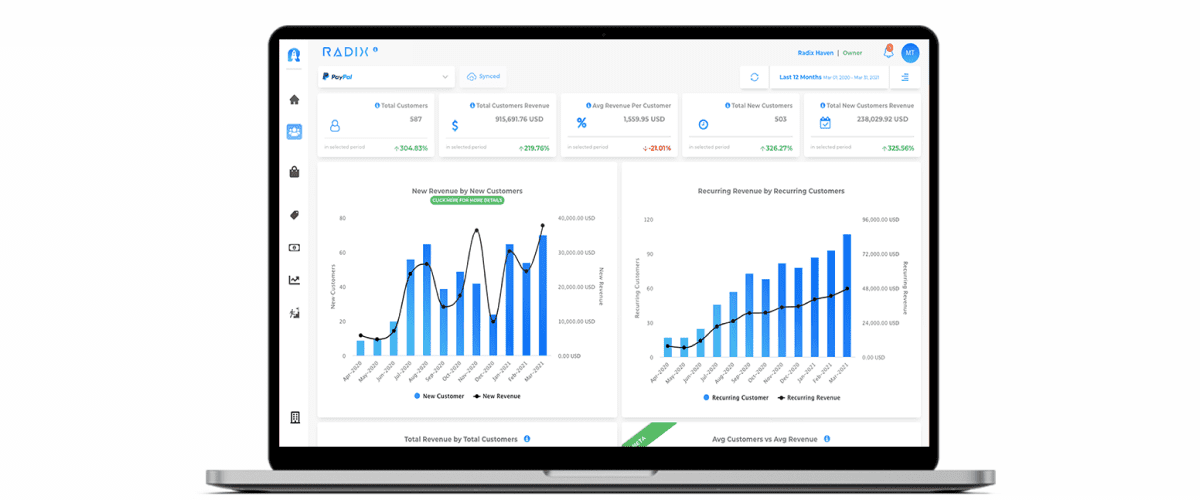
Try Radix by connecting your PayPal and Stripe accounts in less than five minutes for a more accurate calculation of your business’s MRR.
The #1 Data Analytics Platform for SaaS and eCommerce.
Sign Up Here!

Read More:
MRR: What is Monthly Recurring Revenue?
Improve MRR Performance:10 Tips for Improving Your MRR for Better Business Growth
Financial Forecasting… What is it?
Churn Prevention: How to Identify & Prevent Churn with Radix


