It is always important to understand what we visualize-Stripe metrics with Radix- especially with graphic and numerical representations generated by our business. Being clear about everything our dashboards represent is vital to making decisions that impact the operation and growth of our company.
Below, we’ll show you some of the most relevant stripe metrics in our platform.
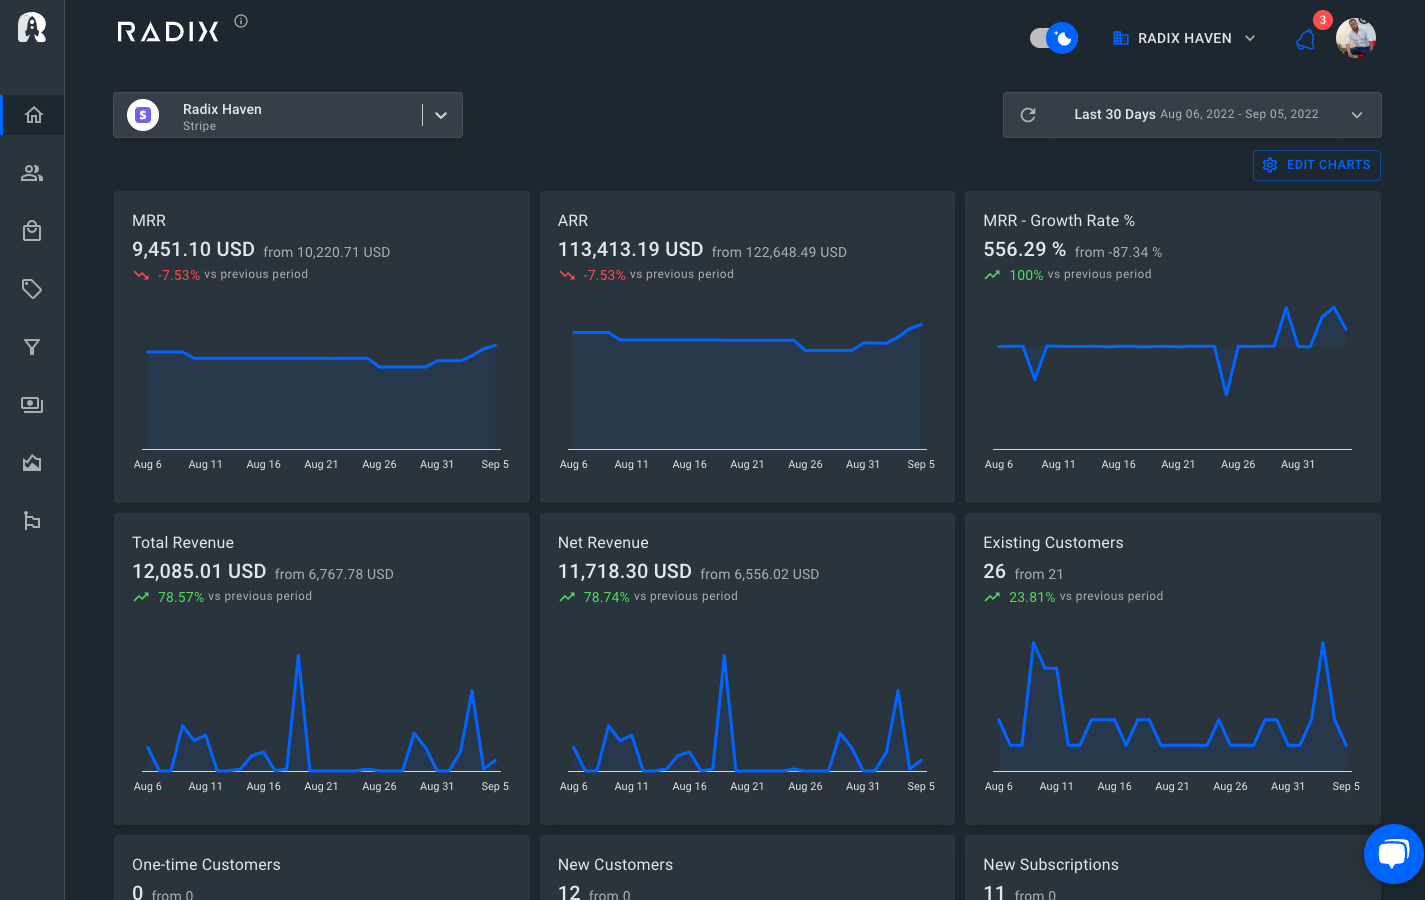
I took a screenshot of Radix’s main dashboard and chopped all of the visible metrics blocks into the pictures you see below. I didn’t leave any metrics out since I think it’s important to cover all bases. You are free to skip the ones that don’t interest you.
The first paragraph explains the metric, followed by a graph and numbers for the metric, and then a brief explanation.
Total Revenue
Total Revenue = The overall sales value. Fees, refunds, and disputes are all included in this number.
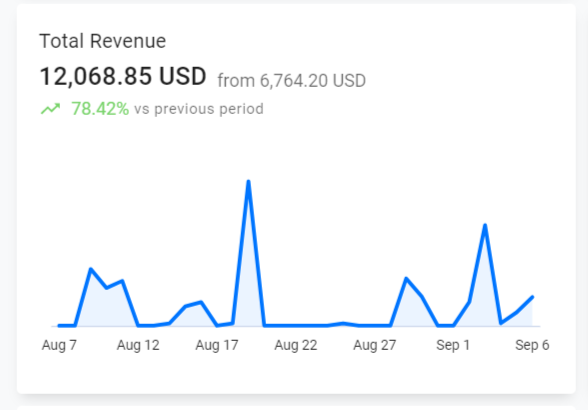
It’s tempting to focus solely on the MRR while growing a company, but looking at the gross volume may provide a good push. You may say: “My customers paid me this much for my service,”. That’s a pleasant sensation. Gross Volume is an excellent metric to consider.
Net Revenue
This metric represents the estimated revenue from payments after fees, refunds, disputes, and Connect transfers have been deducted.
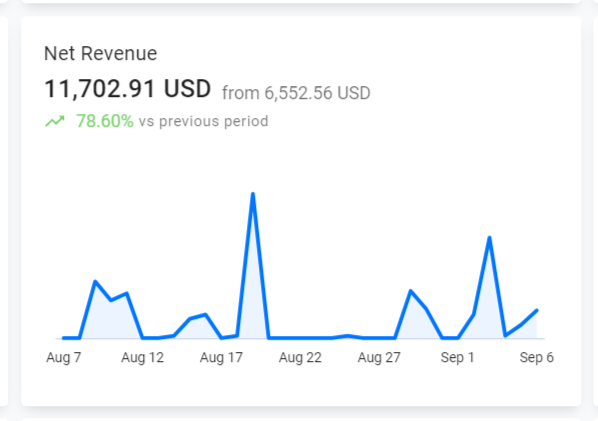
This is nearly identical to the gross volume. As fees, refunds, and disputes are removed, it is logically smaller than the gross volume.
New Customers
The total number of new customers, including those who are no longer active. Customers who have been erased are referred to as inactive customers.
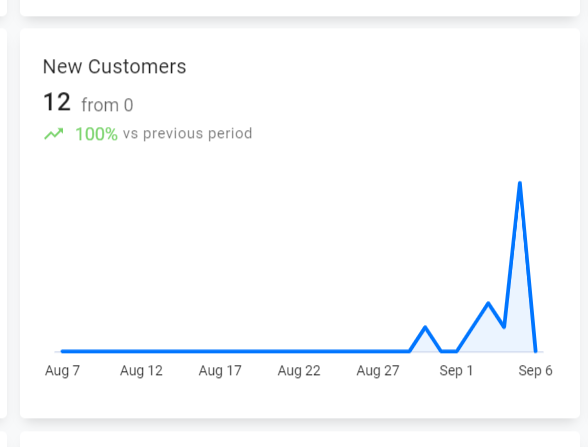
With this metric you can track and analyze how many customers your business is gaining over a period of time.
Total Payments
Payments that did not fail = Total payments

Successful payments in SaaS mean retention is high and customers are happy. It also means that your business model stays viable and you aren’t hemorrhaging too much money on customer acquisition. Successful payment processing in SaaS is important with subscriptions and is a big part of customer experience. This is one of the most relevant stripe metrics.
New Customers
This is the total number of new non-trial, paying users that have signed up (not including free plans).
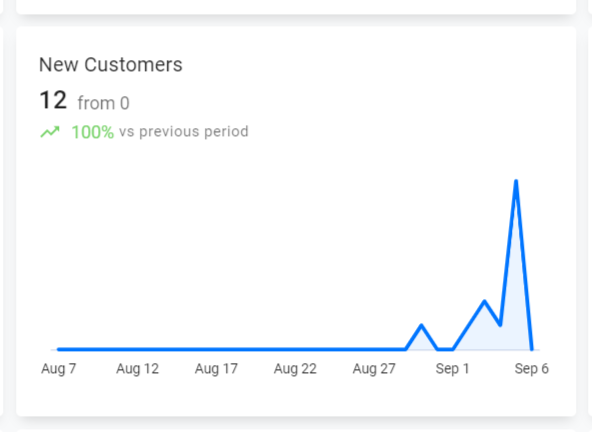
New subscribers are different from new customers. Subscribers are users who have paid for the service. Their trial period has ended, and they have now become a paying customer.
Existing Customers
This is the total number of existing paying customers excluding new subscribers.
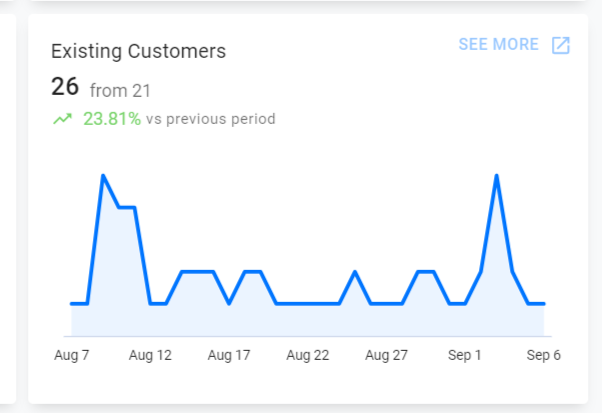
In this case, the existing customers are 21 , but we did not take into consideration the 5 new subscribers. These new one would become active the next month.
MRR
The normalized monthly income from all active and past-due memberships is your monthly recurring revenue (MRR). It’s the most accurate single indicator of a recurring revenue business’s health and trajectory. MRR is one of the most crucial Stripe metrics.
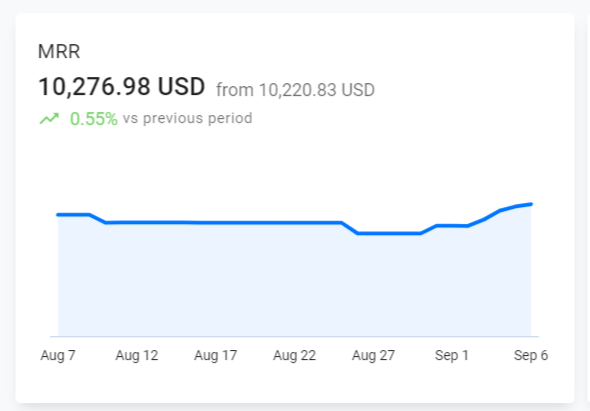
It’s the most critical metric for a subscription-based business, especially for SaaS. Founders, investors or members of the boards take a close look at this metric because it defines the past, present and future of your business health.
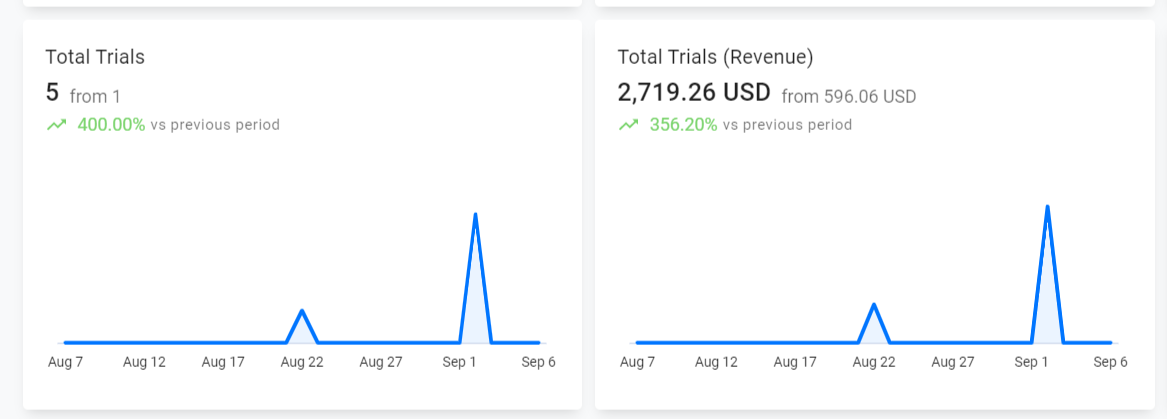
Total Trials & Total Trials (Revenue)
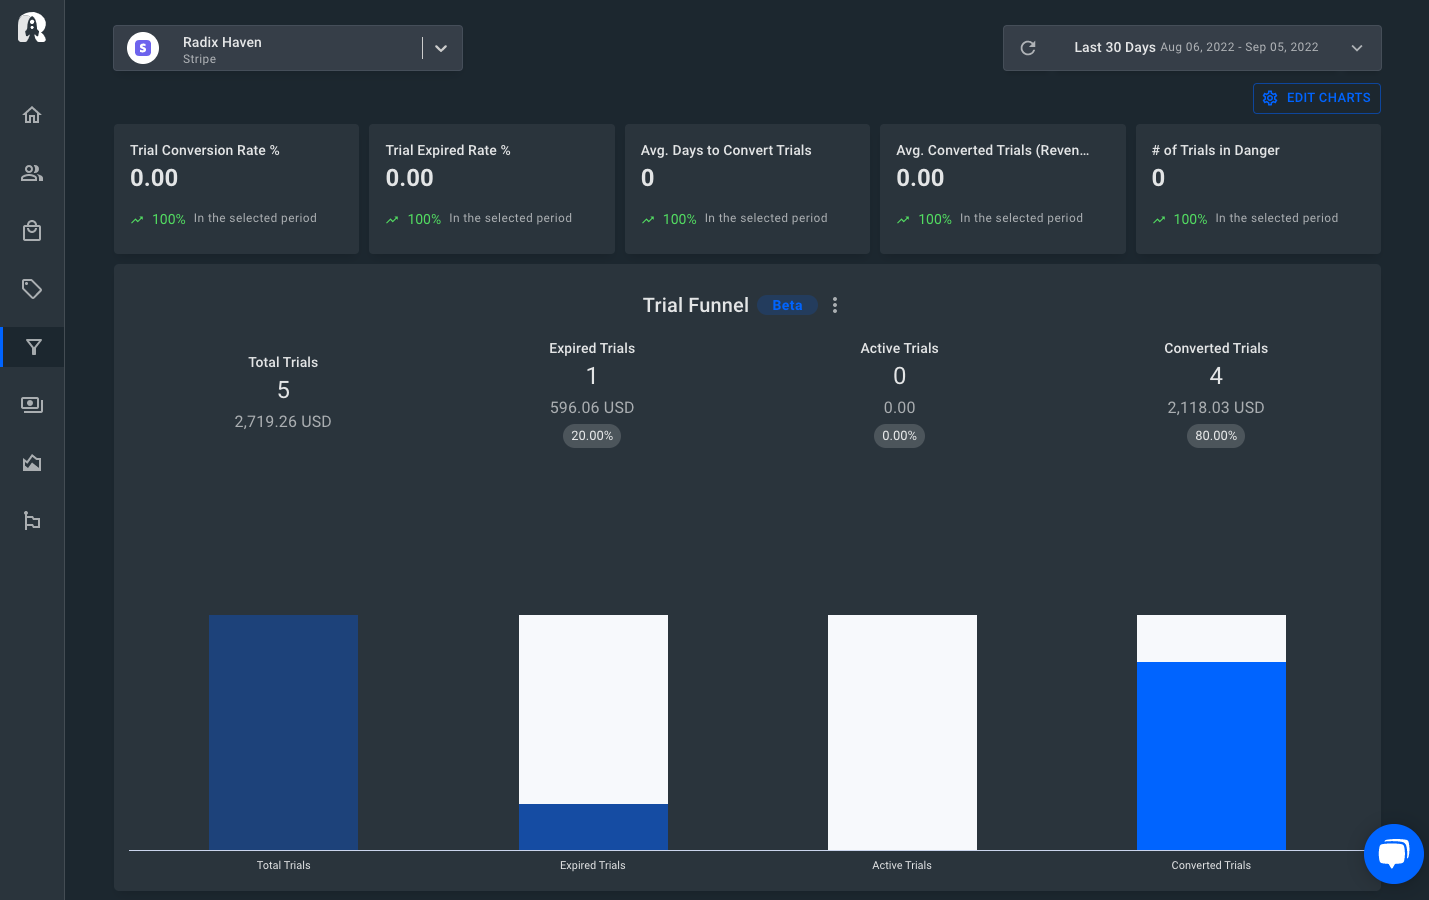
Total Trials = The total number of new subscriptions that began with a free trial period. The trial conversion rate is a metric that indicates how well you convert trials into active subscriptions throughout 30 days. Your trial conversion rate is the proportion of all trials that finished in the previous 30 days that converted to an active subscription.
Subscriber Lifetime Value
This is a rough estimate of how much money you may anticipate to make from a typical customer before they leave.
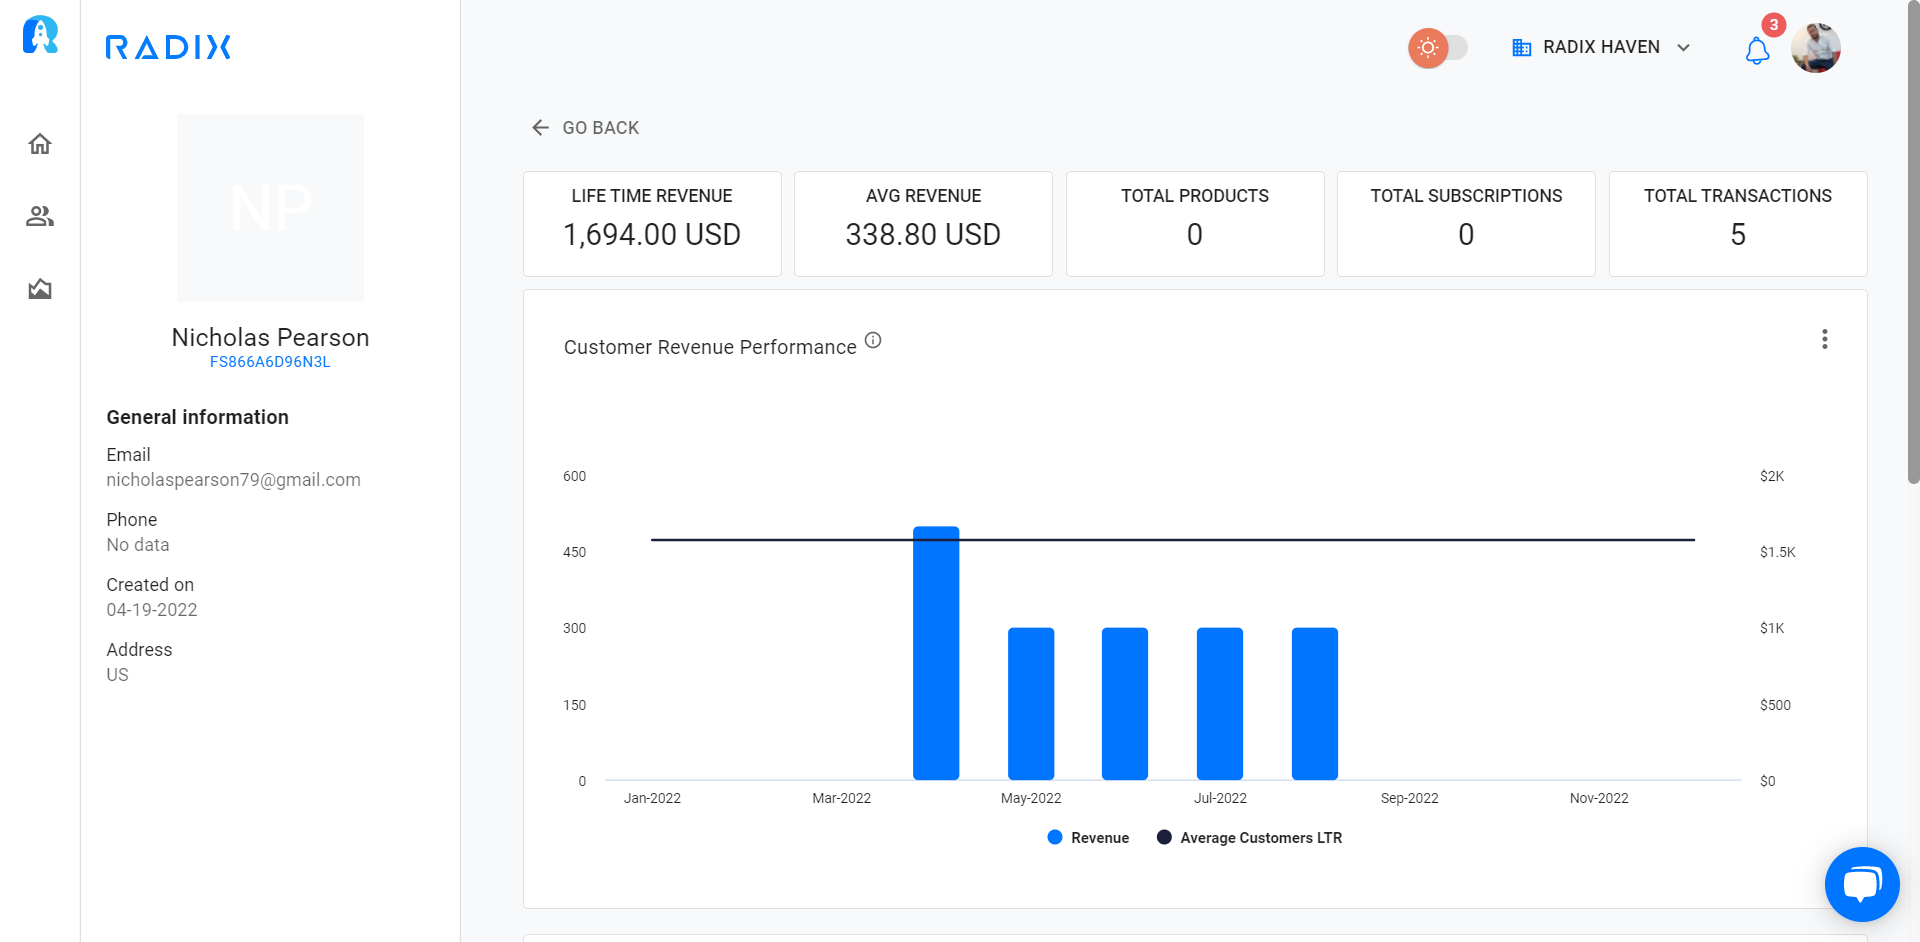
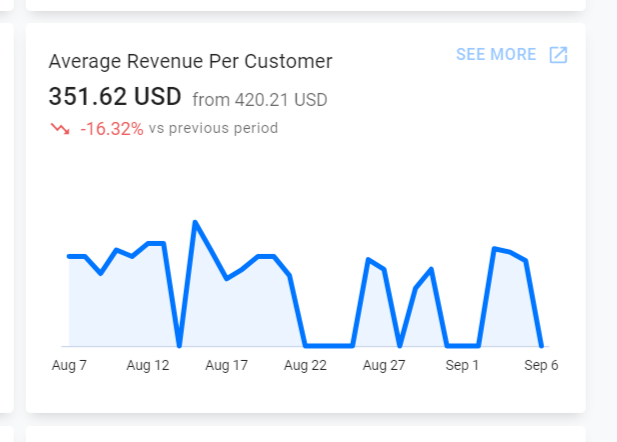
Average Revenue Per Customer
This is the average MRR per customer for your company. It’s derived by multiplying your MRR by the total number of active subscription customers.
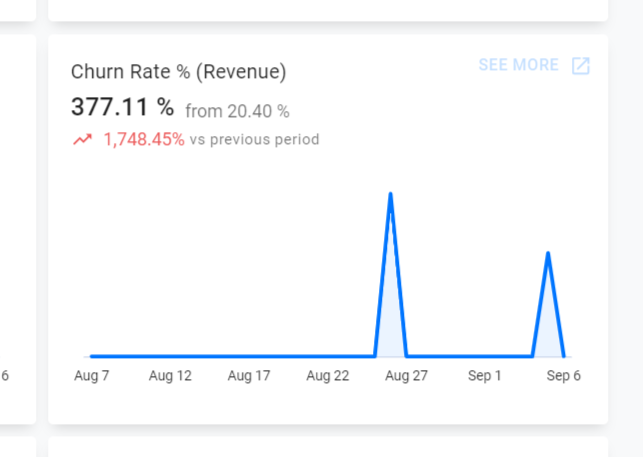
Subscriber Churn Rate
This is the percentage of your subscribers that have left in the last 30 days. Your churn rate is the proportion of active customers at the start of the term who cancel during the period, including any new customers.
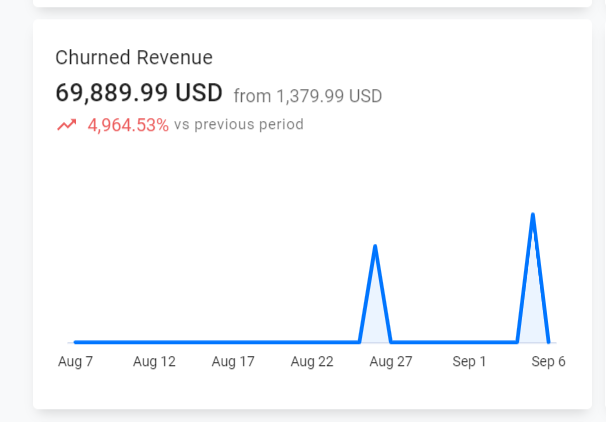
Churned Revenue – Stripe Metrics
This is the total MRR lost due to downgrades or cancellations over the period (both voluntary or involuntary due to lack of payment).
Over to You…
With Radix you will be able to track & analyze 150+ metrics. We are the #1 Data Revenue Platform for Stripe.
With our tool, you will be able to:
- Keep track of your MRR and ARR movements.
- Stay on top of your sales performance from anywhere.
- Live stream payments’ status. (Failed, Refunds, Downgrade, Upgrade)
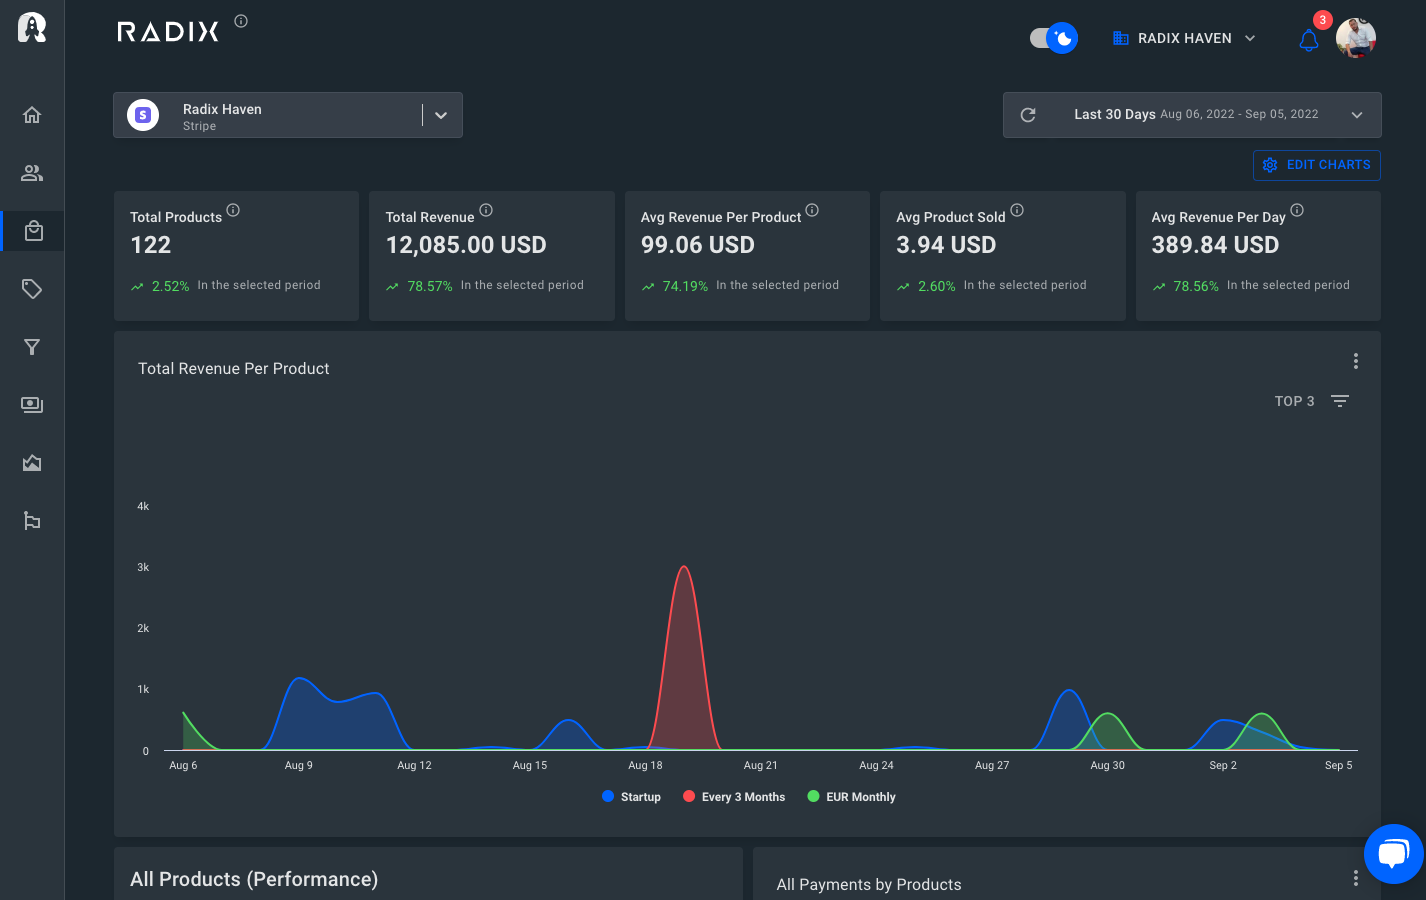
- Gain a deeper understanding of your customers, products, and subscriptions.
Below, you will find examples of some of our dashboards:
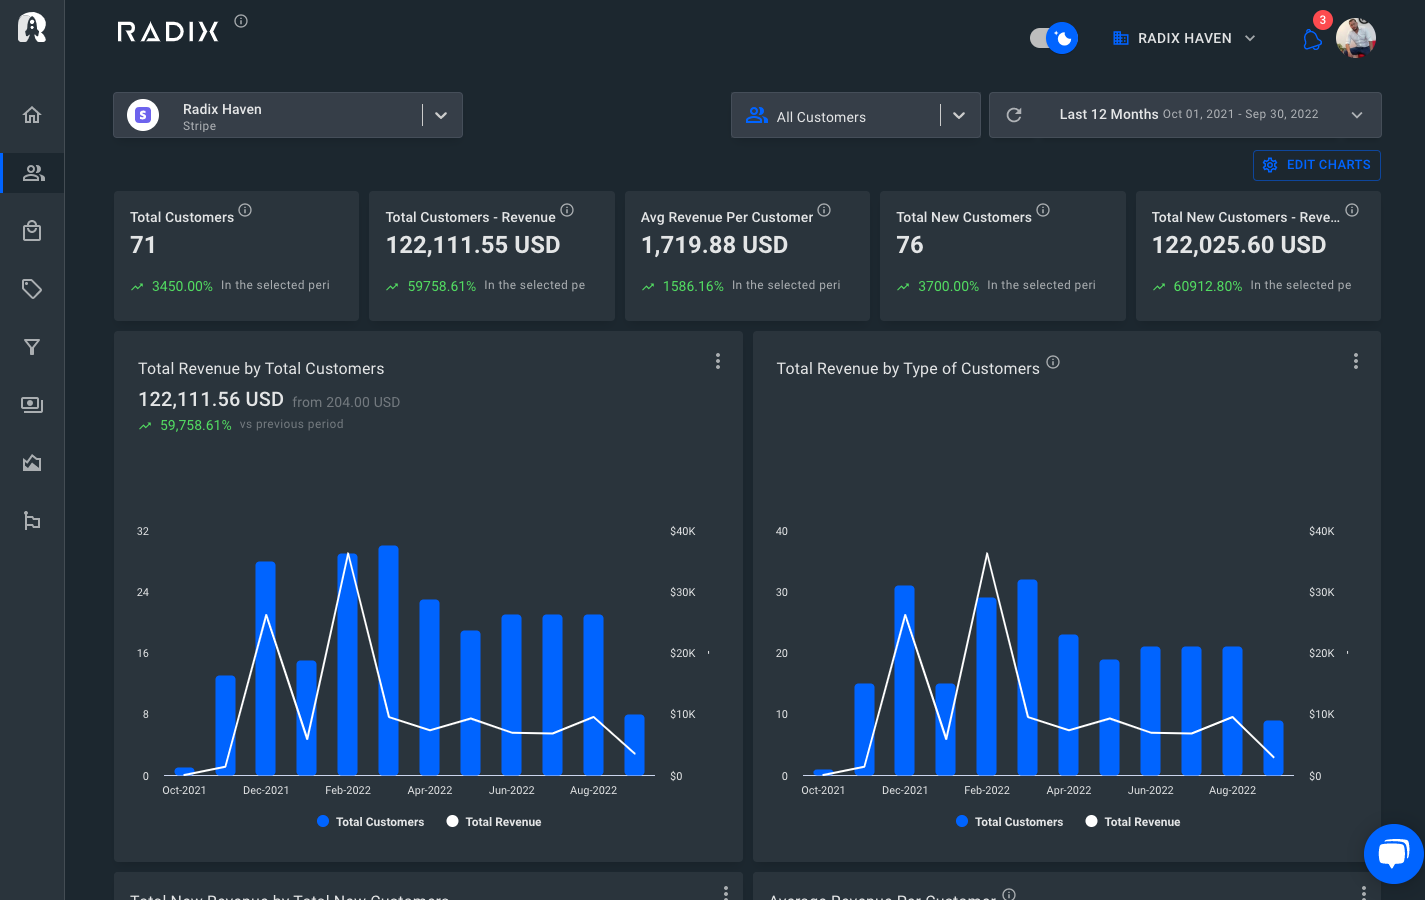
Customer Dashboard
Keep an eye on your trials too
Your Metrics in One Place
See how your products are performing
Sign Up Here!

Read More:
15 Ways to Reduce Churn: Radix Edition
Revenue Churn: Definition, How to Calculate, Ways to Track & Improve
Churn Analysis in SaaS Business


